How Power BI Dashboards & Finance Boost Growth – The Ledger Max
Published by TheLedgerMax.com | Updated October 2025
In today’s fast-paced business world, companies that grow consistently are those that understand their numbers—clearly, quickly, and strategically. At The Ledger Max, we empower startups, SMEs, and enterprises with Financial Calculators and Power BI Dashboards to make smarter decisions, improve visibility, and achieve yearly growth targets with confidence.
What Are Financial Calculators?
A financial calculator is a digital tool that simplifies complex financial planning. Instead of guesswork, it helps business owners and finance teams calculate:
- ✅ Return on Investment (ROI)
- ✅ Break-even Point
- ✅ Net Profit Margin
- ✅ Revenue Growth Projections
- ✅ Loan or Installment Plans
- ✅ Cash Flow Forecasts
With these tools, businesses gain accuracy, speed, and clarity—leading to better financial decisions.
What Is Power BI and Why Businesses Use It?
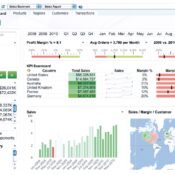
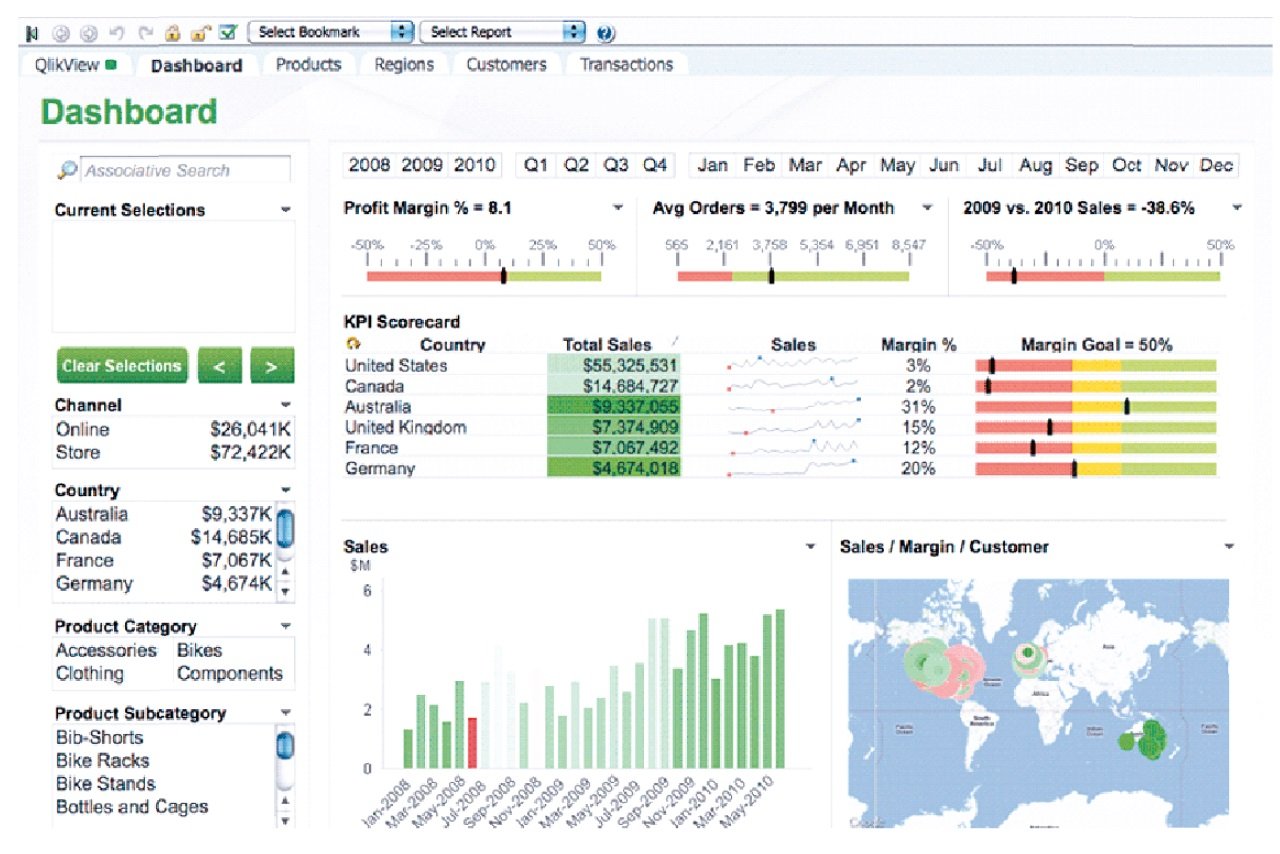
Power BI, Microsoft’s business analytics platform, turns your raw financial and operational data into interactive dashboards and real-time reports.
At The Ledger Max, we integrate Power BI with your data sources (Excel, QuickBooks, CRMs, Google Sheets, sales reports) to give you clear visibility across departments.
👉 Instead of waiting for monthly reports, you get live insights for better, faster decisions.
How Financial Calculators & Power BI Drive Business Growth
1. Smarter Financial Decisions
- Financial calculators provide fast and accurate numbers.
- Power BI highlights patterns and trends visually.
👉 Together, they remove confusion and guide confident decision-making.
2. Clear Yearly Forecasts
Simulate and plan for:
- Quarterly sales growth
- Expense-to-revenue ratio
- Profit margins by product or service
This makes budgeting and forecasting simple and accurate.
3. Real-Time Business Visibility
With Power BI dashboards, you can monitor:
- Daily cash flow
- Customer acquisition costs
- Department-wise performance
👉 No delays—business leaders get instant visibility.
4. Continuous KPI Tracking
Stay on top of your growth drivers:
- Gross Profit %
- Inventory Turnover
- Client Retention Rate
- ROI on Marketing Campaigns
Consistent tracking means no missed opportunities.
5. Professional Reporting for Stakeholders
At The Ledger Max, we design custom reports ideal for:
- Investor updates
- Loan applications
- Internal performance reviews
- Board or stakeholder meetings
Case Study: SME Growth with The Ledger Max
Client: An ecommerce business in Lahore
Challenge: Rising operational costs, no visibility on true profit margins
Solution:
- Used a Profit Margin Calculator to identify weak product lines
- Built a Power BI dashboard to compare weekly ad spend vs. sales
Result: Eliminated underperforming SKUs and improved net profit margins by 17% in 6 months
Tools & Solutions by The Ledger Max
We provide businesses with a complete suite of financial tools:
- 📊 ROI Calculator
- 📊 Break-even Calculator
- 📊 Cash Flow Tracker
- 📊 Tax Estimator
- 📊 Expense Monitoring
- 📊 Revenue Forecast Tool
- 📊 Department KPI Dashboards
All calculators and dashboards can be seamlessly integrated with QuickBooks, Excel, Google Sheets, and CRMs for a streamlined workflow.
FAQs
Q1: What is the role of Power BI in financial management?
Power BI provides real-time financial visibility, turning raw data into clear, actionable insights.
Q2: How do financial calculators help SMEs?
They simplify decision-making by accurately calculating ROI, margins, and forecasts.
Q3: Can Power BI integrate with QuickBooks and Excel?
Yes, The Ledger Max connects Power BI with QuickBooks, Excel, CRMs, and other data sources.
Q4: What KPIs should small businesses track?
Key KPIs include Gross Profit %, ROI on campaigns, cash flow, and client retention rate.
Q5: How does The Ledger Max improve yearly growth?
We provide tailored tools, real-time dashboards, and expert guidance for sustainable business expansion.
Conclusion: Gain Visibility, Gain Growth
At The Ledger Max, we believe: Visibility = Growth. By combining Financial Calculators with Power BI, your business gains:
- ✅ Transparency into financial performance
- ✅ Speed in decision-making
- ✅ Confidence in investor/stakeholder communication
- ✅ Steady yearly growth
👉 Ready to grow smarter? Contact The Ledger Max today and discover how we can help transform your financial clarity and business growth.